Data to Science · 3 of 3 · Relative Intensity → Temperature
How the temperature scale was built, step by step
Turning a relative radio measurement into kelvin is hard, and the project's understanding improved in five documented stages. Each stage is kept as an immutable calibration epoch. C4 is the current reference.
- Relative measured intensityMeasured
- CalibrationAssumptions + measurements
- Physical temperature scaleDerived, with uncertainty
Calibration is a scientific transformation. It rests on assumptions, on separate measurements, and carries uncertainty. A temperature is only as good as the stage of calibration it was made with, which is why each product keeps its epoch.
Fixed-telescope historical spectra Calibration under validation
The history below is for DISH222. Absolute calibration of the historical fixed-dish spectra has not been validated, so no temperature values are given for them.
Current reference · C4
The sky-referenced calibration of 23 Sep 2026
The measured fractional line excess f is converted to brightness temperature with a conversion constant G and an additive pedestal p.
T_B = (f - p) G, G = T_sys / eta
How C4 was obtained
Eight sky positions, whose true brightness is known from the LAB survey smoothed to DISH222's 3° beam, were observed on the evening of 23 Sep 2026. They span about 8 K to 78 K. Plotting the measured f against the LAB brightness gives a straight line whose slope is 1/G and whose intercept is the pedestal p.
Using several brightness levels was the key step: a single reference point cannot separate a scale factor from an offset. The implied efficiency η = 0.616 agrees with an independent measurement of the aperture efficiency from a solar transit (0.582).
Limits of C4
- The scatter about the fit is about 8.5 K per measurement, set mainly by the receiver noise.
- Linearity cannot yet be confirmed, and the pedestal is applied as a constant although the underlying baseline defect is sloped.
- It is valid for the hardware state of 20–23 Sep 2026 and should be repeated after hardware changes.
- Because it is anchored to LAB, comparing C4-scaled data with LAB is a consistency check, not an independent test.
History
C0 → C4: an evolution of understanding
Each stage was a reasonable step with the evidence available at the time, and each revealed what the next one had to fix. The products listed under each epoch remain on that epoch's scale.
Old products keep their scale
A map made on 2 Sep with the C2 scale stays a C2 map. It is not silently relabelled when a better calibration arrives, because its processing (baseline, efficiency, pedestal) differed and that history matters for interpreting it.
C4 has not been applied retroactively
No map, cube or table in the archive has been recalibrated to C4. The only item carrying C4 is the calibration report that defines it. Brightness values in historical products must be read on their own epoch's scale.
Re-deriving creates a new product
If you express older data on the C4 scale (possible for the 2 Sep antenna-temperature cube, for example), the result is a new dataset with its own ID and an explicit record of what it was derived from. The original stays untouched.
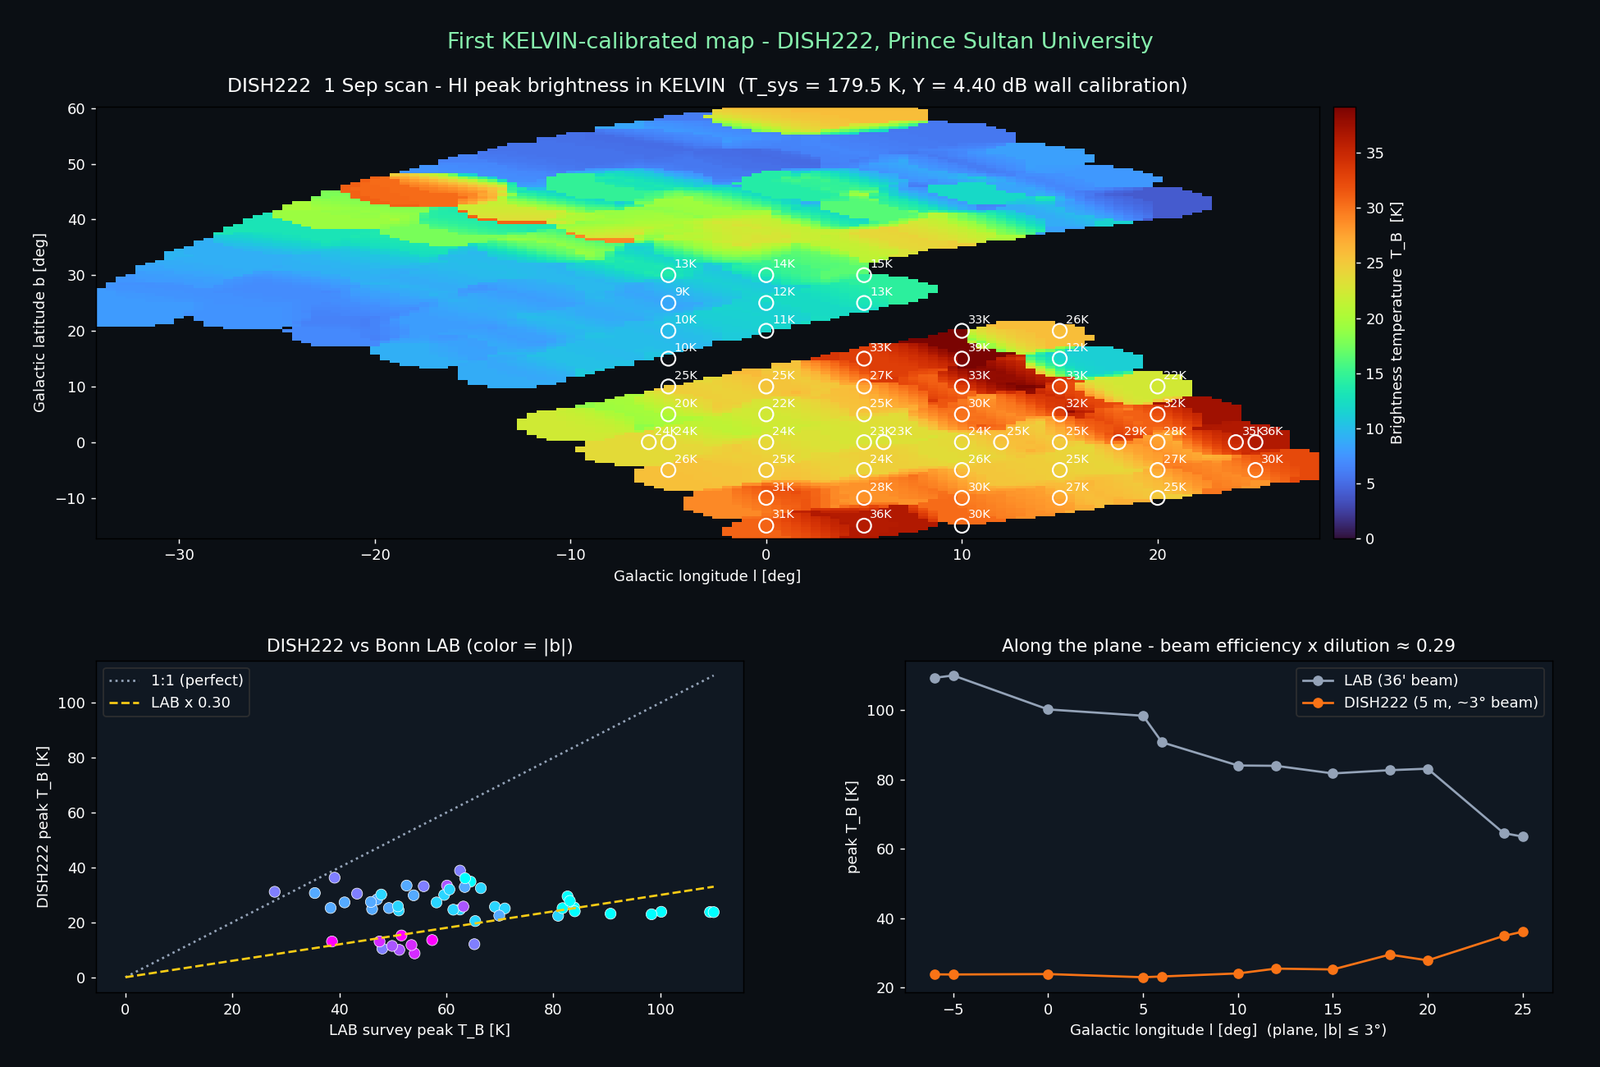
The first kelvin-calibrated map (1 Sep 2026)
What it shows: peak H I brightness based on the 1 Sep 2026 observation, re-derived using the C2 calibration established on 2 Sep 2026 (Tsys = 179.5 K, η = 0.30), and compared with the LAB survey. The lower panels show DISH222 reading about 0.30 of LAB along the plane, which is where the C2 efficiency η = 0.30 came from.
Status: a historical product on the superseded C2 scale. It is not on the current C4 scale and has not been recalibrated. The calibration it uses was established the day after the observation, and the efficiency was derived from the same map it was applied to. The native data behind it are not in the research archive.
What to learn: why a single scale factor fitted on one map cannot separate beam efficiency from other effects, and what the later sky-referenced method (C4) does differently.